本文共 8934 字,大约阅读时间需要 29 分钟。
本文翻译自Adam King于2019.4.18发表的《》,英文好的建议看原文。此翻译版本只是自我学习。水平有限,望不吝指正。
我们打算扩展上次教程的代码,用Matplotlib为环境提供富有洞察力的可视化。如果你没有阅读我的第一篇文章《》,你可以此处暂停,先看一下。
如果你不熟matplotlib库,不用担心。我们会一行一行过代码,你一定可以为自己的环境创建自定义可视化。一如既往,本教程代码见.
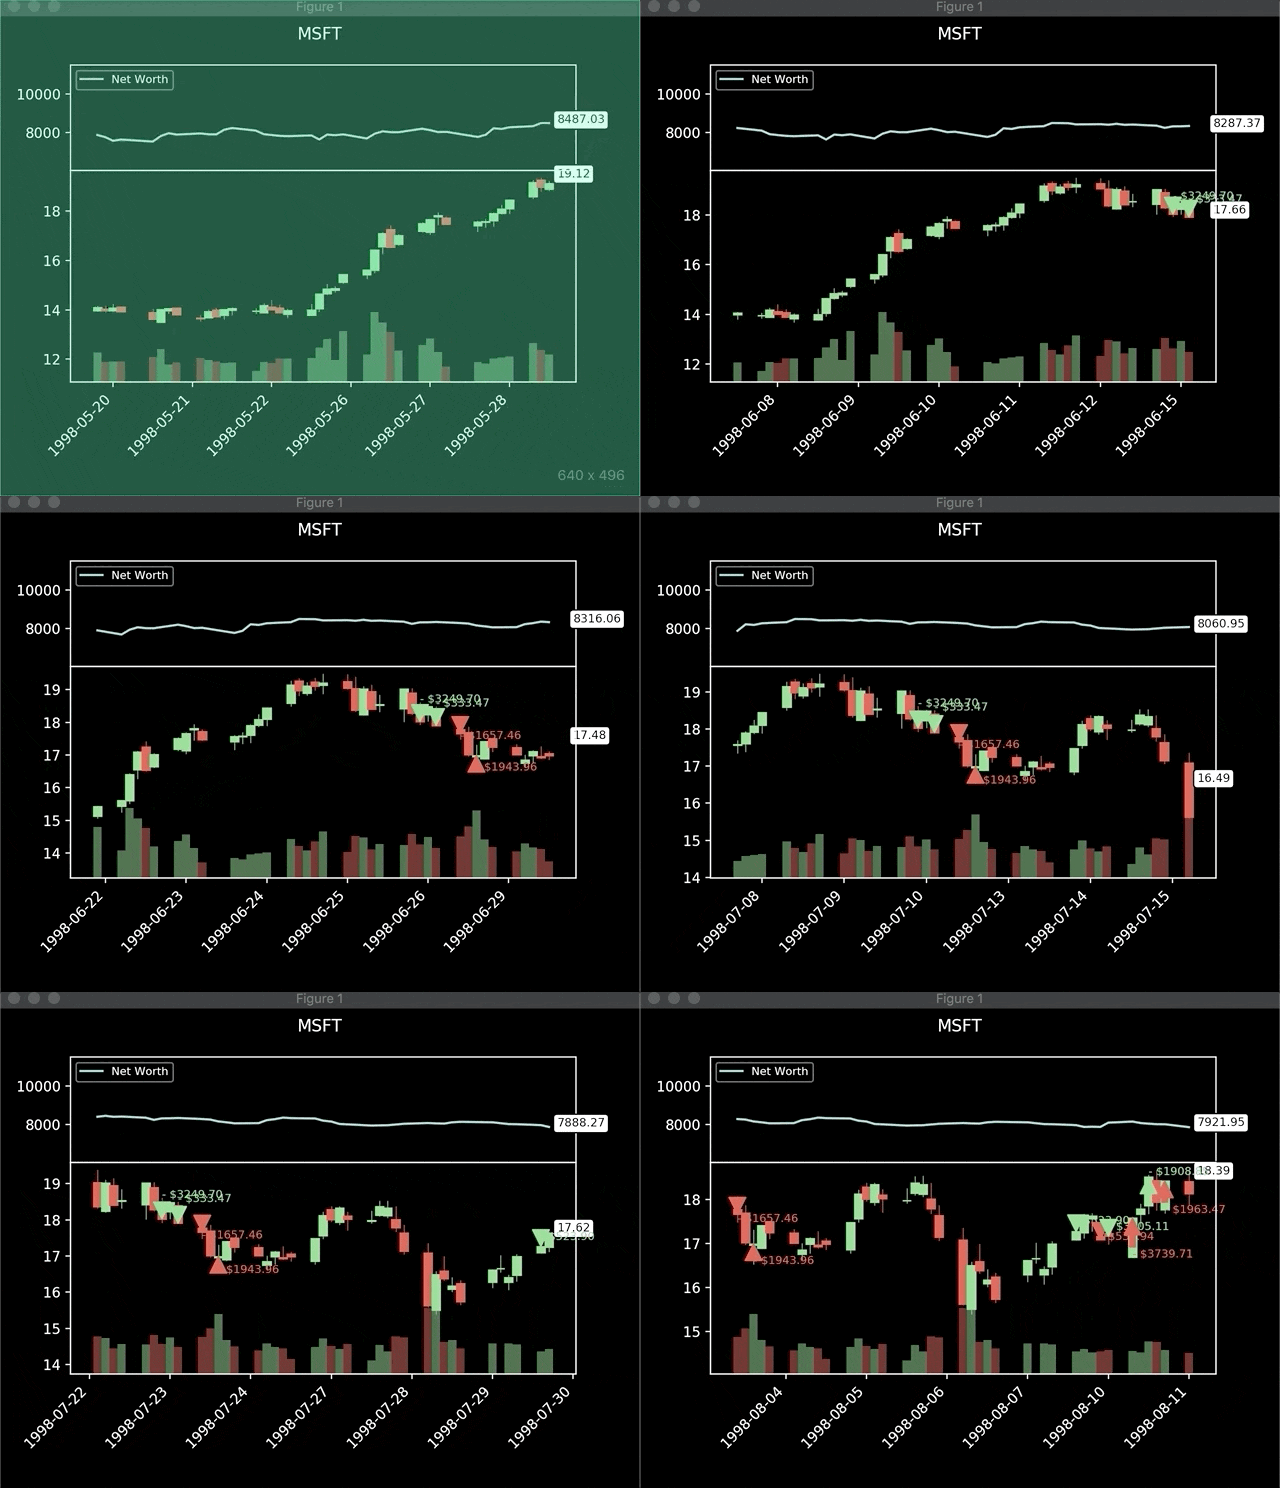
这是我们本文工作结果的预演:

如果它看起来很复杂,实际上没那么糟糕。只是每步(step)更新几个图表,并附带几个关键注释。开始吧。
-
股票交易可视化
上篇教程中,我们用输出声明来展示智体(
agent)净值及其他重要度量的方式写了一个简单的render方法。让我们将上述逻辑移至一个新的方法_render_to_file以便有需要时可以保存特定时期的交易度量到某文档。def _render_to_file(self, filename='render.txt'): profit = self.net_worth - INITIAL_ACCOUNT_BALANCE file = open(filename, 'a+') file.write(f'Step: {self.current_step}\n') file.write(f'Balance: {self.balance}\n') file.write(f'Shares held: { self.shares_held} (Total sold: { self.total_shares_sold})\n') file.write(f'Avg cost for held shares: { self.cost_basis} (Total sales value: { self.total_sales_value})\n') file.write(f'Net worth: { self.net_worth} (Max net worth: { self.max_net_worth})\n') file.write(f'Profit: {profit}\n\n') file.close()现在,让我们重新创建新
render方法。需要用到StockTradingGraph类,我们还没写。下一步写。def render(self, mode='live', title=None, **kwargs): # Render the environment to the screen if mode == 'file': self._render_to_file(kwargs.get('filename', 'render.txt')) elif mode == 'live': if self.visualization == None: self.visualization = StockTradingGraph(self.df, title) if self.current_step > LOOKBACK_WINDOW_SIZE: self.visualization.render(self.current_step, self.net_worth, self.trades, window_size=LOOKBACK_WINDOW_SIZE)这里我们用kwargs传递可选参数
filename、title给StockTradingGraph.如果你不熟悉kwargs,可以简单理解为给函数传递可选关键字参数的字典。为可视化我们也传递
self.teades给render,但是还未定义。回看_take_action方法,无论何时买卖股票,都是将事件加到self.trades对象中,此对象会被reset方法初始化为[].def _take_action(self, action): ... if action_type < 1: ... if shares_bought > 0: self.trades.append({ 'step': self.current_step, 'shares': shares_bought, 'total': additional_cost, 'type': "buy"}) elif action_type < 2: ... if shares_sold > 0: self.trades.append({ 'step': self.current_step, 'shares': shares_sold, 'total': shares_sold * current_price, 'type': "sell"})现在我们的
StockTradingGraph类包含呈现股价历史和成交量所需的一切信息,同时伴随着智体的净值和它所作的所有交易。让我们开始呈现可视化。首先定义
StockTradingGraph及其__init__方法。就是在此创建pyplot图像,并设置每个需要呈现的子图。date2num函数将时间格式转为时间戳,在稍后的呈现过程中需要。import numpy as npimport matplotlibimport matplotlib.pyplot as pltimport matplotlib.dates as mdatesdef date2num(date): converter = mdates.strpdate2num('%Y-%m-%d') return converter(date)class StockTradingGraph: """A stock trading visualization using matplotlib made to render OpenAI gym environments""" def __init__(self, df, title=None): self.df = df self.net_worths = np.zeros(len(df['Date'])) # Create a figure on screen and set the title fig = plt.figure() fig.suptitle(title) # Create top subplot for net worth axis self.net_worth_ax = plt.subplot2grid((6, 1), (0, 0), rowspan=2, colspan=1) # Create bottom subplot for shared price/volume axis self.price_ax = plt.subplot2grid((6, 1), (2, 0), rowspan=8, colspan=1, sharex=self.net_worth_ax) # Create a new axis for volume which shares its x-axis with price self.volume_ax = self.price_ax.twinx() # Add padding to make graph easier to view plt.subplots_adjust(left=0.11, bottom=0.24, right=0.90, top=0.90, wspace=0.2, hspace=0) # Show the graph without blocking the rest of the program plt.show(block=False)我们用
plt.subplot2grid(...)方法首先在图片上方创建一个子图用于呈现净值网格,然后在下方创建另一个子图呈现价格网格。subplot2grid第一个参数是子图大小,第二个参数是位于图形中的位置。为呈现成交量柱,在
self.price_ax上调用twinx()方法,实现在上部叠加共享x轴的另一个网格。最后,也是最重要的,用plt.show(block=False)将图形呈现在屏幕上。如果你忘记传递参数block=False,你只能看到呈现第一步,之后智体的操作都被屏蔽了。

然后,让我们写出render方法。这会从当前步获取所有信息并实时呈现在屏幕上。
def render(self, current_step, net_worth, trades, window_size=40): self.net_worths[current_step] = net_worth window_start = max(current_step - window_size, 0) step_range = range(window_start, current_step + 1) # Format dates as timestamps, necessary for candlestick graph dates = np.array([date2num(x) for x in self.df['Date'].values[step_range]]) self._render_net_worth(current_step, net_worth, window_size, dates) self._render_price(current_step, net_worth, dates, step_range) self._render_volume(current_step, net_worth, dates, step_range) self._render_trades(current_step, trades, step_range) # Format the date ticks to be more easily read self.price_ax.set_xticklabels(self.df['Date'].values[step_range], rotation=45, horizontalalignment='right') # Hide duplicate net worth date labels plt.setp(self.net_worth_ax.get_xticklabels(), visible=False) # Necessary to view frames before they are unrendered plt.pause(0.001)
在此我们保存net_worth,然后从头到尾呈现每一图。同时将智体用self.render_trades方法所执行交易标注股价图表。调用plt.pause()很重要,不然在最后一帧呈现在屏幕上之前,每帧都会被下次调用render时清空。
现在,让我们看看render方法的每个图表,从净值开始。
def _render_net_worth(self, current_step, net_worth, step_range, dates): # Clear the frame rendered last step self.net_worth_ax.clear() # Plot net worths self.net_worth_ax.plot_date(dates, self.net_worths[step_range], '- ', label='Net Worth') # Show legend, which uses the label we defined for the plot above self.net_worth_ax.legend() legend = self.net_worth_ax.legend(loc=2, ncol=2, prop={ 'size': 8}) legend.get_frame().set_alpha(0.4) last_date = date2num(self.df['Date'].values[current_step]) last_net_worth = self.net_worths[current_step] # Annotate the current net worth on the net worth graph self.net_worth_ax.annotate('{0:.2f}'.format(net_worth), (last_date, last_net_worth), xytext=(last_date, last_net_worth), bbox=dict(boxstyle='round', fc='w', ec='k', lw=1), color="black", fontsize="small") # Add space above and below min/max net worth self.net_worth_ax.set_ylim( min(self.net_worths[np.nonzero(self.net_worths)]) / 1.25, max(self.net_worths) * 1.25) 我们只是调用plot_date(...)在净值子图上绘制简单线条,然后标出当前净值。并添加一个图例。

呈现价格图表稍有复杂,简单起见,我们对OHCL和成交量分开呈现。首先,如没有先安装pip install mpl_finance。这个包我们会用于呈现蜡烛图。然后在文件首行增加下面代码。
from mpl_finance import candlestick_ochl as candlestick
清空前帧,加入OHCL数据,并在self.price_ax子图呈现蜡烛图
def _render_price(self, current_step, net_worth, dates, step_range): self.price_ax.clear() # Format data for OHCL candlestick graph candlesticks = zip(dates, self.df['Open'].values[step_range], self.df['Close'].values[step_range], self.df['High'].values[step_range], self.df['Low'].values[step_range]) # Plot price using candlestick graph from mpl_finance candlestick(self.price_ax, candlesticks, width=1, colorup=UP_COLOR, colordown=DOWN_COLOR) last_date = date2num(self.df['Date'].values[current_step]) last_close = self.df['Close'].values[current_step] last_high = self.df['High'].values[current_step] # Print the current price to the price axis self.price_ax.annotate('{0:.2f}'.format(last_close), (last_date, last_close), xytext=(last_date, last_high), bbox=dict(boxstyle='round', fc='w', ec='k', lw=1), color="black", fontsize="small") # Shift price axis up to give volume chart space ylim = self.price_ax.get_ylim() self.price_ax.set_ylim(ylim[0] - (ylim[1] - ylim[0]) * VOLUME_CHART_HEIGHT, ylim[1]) 
用股票当前价格注释图表,然后移动图表以防与成交量重叠。下面看看成交量呈现方法,这就更简单了因为没有注释环节。
def _render_volume(self, current_step, net_worth, dates, step_range): self.volume_ax.clear() volume = np.array(self.df['Volume'].values[step_range]) pos = self.df['Open'].values[step_range] - \ self.df['Close'].values[step_range] < 0 neg = self.df['Open'].values[step_range] - \ self.df['Close'].values[step_range] > 0 # Color volume bars based on price direction on that date self.volume_ax.bar(dates[pos], volume[pos], color=UP_COLOR, alpha=0.4, width=1, align='center') self.volume_ax.bar(dates[neg], volume[neg], color=DOWN_COLOR, alpha=0.4, width=1, align='center') # Cap volume axis height below price chart and hide ticks self.volume_ax.set_ylim(0, max(volume) / VOLUME_CHART_HEIGHT) self.volume_ax.yaxis.set_ticks([])
只是一个简单的柱状图,每个柱着红或绿色,颜色取决于当前时间步内股价涨跌。

def _render_trades(self, current_step, trades, step_range): for trade in trades: if trade['step'] in step_range: date = date2num(self.df['Date'].values[trade['step']]) high = self.df['High'].values[trade['step']] low = self.df['Low'].values[trade['step']] if trade['type'] == 'buy': high_low = low color = UP_TEXT_COLOR else: high_low = high color = DOWN_TEXT_COLOR total = '{0:.2f}'.format(trade['total']) # Print the current price to the price axis self.price_ax.annotate(f'${total}', (date, high_low), xytext=(date, high_low), color=color, fontsize=8, arrowprops=(dict(color=color))) 完工。现在我们就实现了上篇文章所建股票交易环境的美妙且实时的可视化。令人揪心的是我们依然没有对如何教智体赚钱投入更多时间。这部分我们留到下次来讲。

还算可以!下周我们在此基础上《建立不亏钱的BTC交易机器人》。
感谢阅读,一如既往,所有代码可见于我的。如有任何问题,请留言,我乐于见到你的反馈。
转载地址:http://iiwr.baihongyu.com/